Learn How to Anticipate and Manage Your Pension Plan’s Risks
With R-Scan, our stochastic modeling tool, we project thousands of individual scenarios:
- Examine the full distribution of possible outcomes from the 5th percentile to the 95th percentile
- Understand the possible ranges of your plan’s funded status and contributions
- Identify the impact of changes in contribution, funding and benefit policies
- Develop the best strategies to shield your plan from extreme events
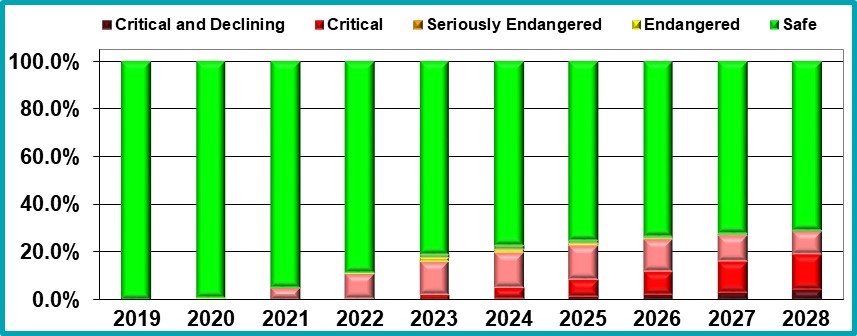
Multiemployer Plan Stochastic or Monte Carlo Projections
This is a sample stochastic or Monte Carlo projection of a multiemployer plan’s funded status generated by Cheiron’s R-Scan tool. In 2019, the plan is in the Safe zone and expected to stay that way if it meets its assumptions. Because investment returns are unpredictable, the R-Scan shows the results of thousands of probable investment scenarios. The graph shows that in more than 75% of these scenarios the plan will remain in the Safe zone through 2028, but in 25% of the scenarios it will not be in the Safe zone. These results assume that the plan does not act in the intervening years to correct any funding problems.
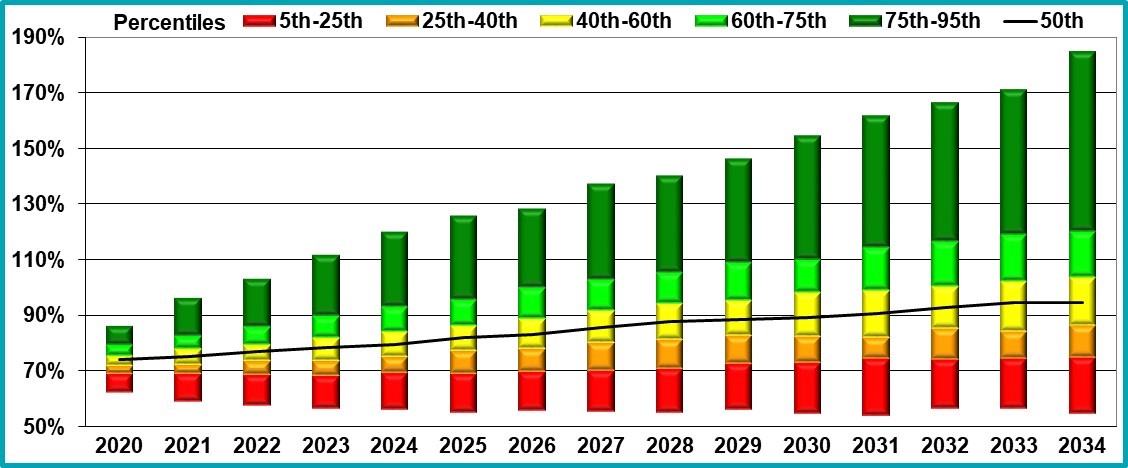
Public Plan Stochastic or Monte Carlo Projections
This is a sample stochastic or Monte Carlo projection of a public retirement system’s funded status generated by Cheiron’s R-Scan tool. In 2019, the system is approximately 75% funded and expected to grow to more than 90% funded by 2033 if it meets its assumptions. Because investment returns are unpredictable, the R-Scan shows the results of thousands of probable investment scenarios. The graph shows that the plan has a more than 95 percent probability of being more than 50% funded and a more than 40% of probability of becoming fully funded by the end of the projection period. These results assume that there are no plan changes that increase or decrease benefits and that the system is funded at the level of the actuarially determined contribution.